Spatial data analysis is a powerful tool that allows researchers to analyze and understand data that have a geographical or spatial component. From understanding patterns in crime rates to predicting the spread of diseases, spatial data analysis can provide valuable insights into a wide range of research questions. In this blog post, we'll introduce some of the key concepts and techniques in spatial data analysis and provide tips for using these tools in your research projects.
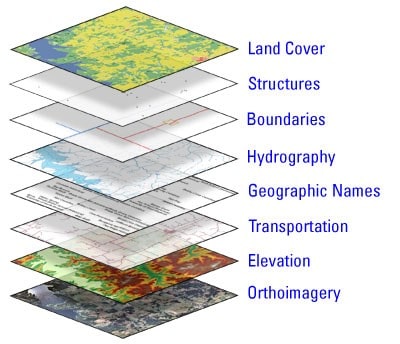
One of the key concepts in spatial data analysis is the use of geographic information systems (GIS) to store, manipulate, and analyze spatial data. GIS software allows researchers to map, visualize, and analyze data that have a geographic component, such as data on population density or environmental conditions.
Another important technique in spatial data analysis is spatial autocorrelation, which refers to the clustering of similar values in space. Spatial autocorrelation can be measured using tools like Moran's I, which allows researchers to identify patterns in spatial data and understand the relationship between variables.
Other key techniques in spatial data analysis include spatial regression, which allows researchers to model the relationship between spatial variables, and spatial interpolation, which is used to estimate values for locations where data are not available.
By understanding and using these tools and techniques, researchers can gain valuable insights into the spatial patterns and relationships in their data. Whether you're a researcher in the social sciences, natural sciences, or any other field, spatial data analysis can provide valuable insights into a wide range of research questions.
Keywords: spatial data analysis, geographic information systems, GIS, spatial autocorrelation, Moran's I, spatial regression, spatial interpolation, research, data visualization.